14 Scenarios: what if…?
Everything up to this point has been about building a model as a tool. This lesson is about using it.
By the end of this lesson, you will be able to:
- make use of a validated simulation model for decision support,
- frame the design: who has to decide, what they can change (the levers), and what is the context,
- formulate a set of scenarios that encode alternative levers to be tested,
- analyse and interpret the scenario simulations against a validated baseline scenario to derive an insight,
- state what a scenario result allows you to claim, and express the uncertainty of your claim.
I refer to Shell (2008, p. 8) for a simple and elegant definition of a scenario:
A scenario is a story that describes a possible future.
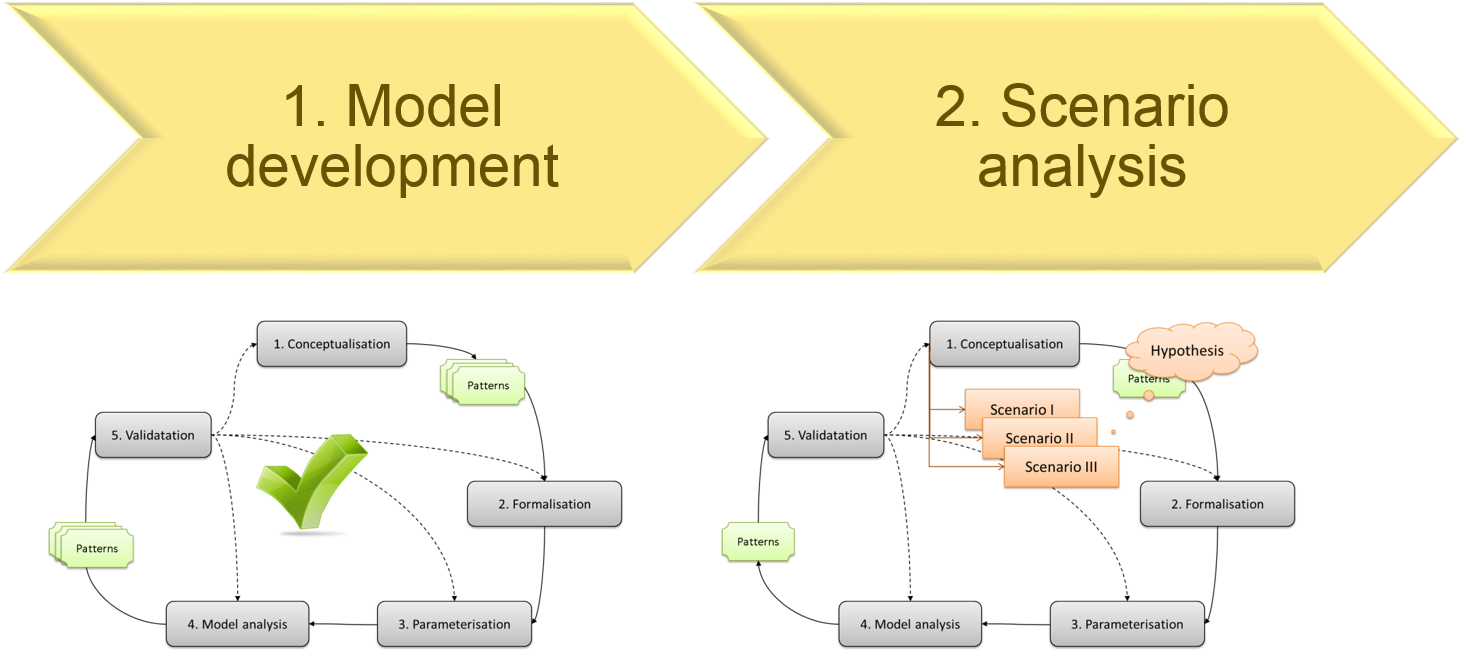
A valid model functions as a sandbox for exploring the effect of alternative courses of actions, by answering “what if…” questions about the modelled system (Figure 14.1).
14.1 Asking the right question
Take these five questions:
- Would additional doors have saved lives in that fire?
- Do more dogs get the flock into the pen faster?
- What happens to motorway traffic as autonomous cars take over?
- How does street infrastructure impact bicycle safety?
- Do a few heavy storms erode more soil than a year of drizzle?
Two of these are decisions that somebody has to make, and three are research questions. In terms of the workflow, it makes no difference: in all cases scenarios compare simulated alternatives. This scenario-analysis workflow from the validated model to the structured design and comparison of scenarios is the subject of this lesson.
In the first lesson we listed the situations in which simulation modelling can answer questions that cannot be answered otherwise. Each of the five questions in Table 14.1 ask such question:
| Question | Why we cannot simply try it out |
|---|---|
| More doors | Too dangerous and too unethical to experiment with |
| More dogs | Observable, but not repeatable often enough to learn from |
| Autonomous cars | The future does not yet exist to be measured |
| Open streets | Expensive to build and expensive to undo |
| Heavy storms | Slower than any experiment we could run |
Working out a good scenario question is harder than it sounds. For a good example of a well-posed question let’s consider the fire-evacuation model (Figure 14.2) that reconstructs a tragic event in Switzerland. On 1 January 2026, 41 people died in the bar Le Constellation in Crans-Montana. Investigators have reported that the main door opened inwards, that an emergency exit in the basement was kept locked, and that a renovation had narrowed the staircase on which most of the victims were found.
14.1.1 Levers and context
The question behind these scenarios is a question about what could have been changed. Scenario analysis calls such “control knob” a lever: would more accessible exits have let people out in time?
Levers are the things a decision maker can change. In a scenario we want to test what would happen, if we changed one. There is also a long list of things that the decision maker cannot change: how many people were inside at the time the fire broke out, how fast the fire spread, how people behaved once they understood what was happening, the weather outside. This is the context.
Levers and context are not properties of the world, but of the decision. The maximum capacity of a bar is a lever for the authority that sets it, and context for the owner who has to work with it. The same model can serve both, with different scenarios. Studies built on levers are called normative or policy scenarios: they ask what we might do about it. Most scenario studies cross the two, running each policy against several futures.
Sometimes we cannot actively change things, they just happen. Still we want to know what might happen, if..? Studies of this kind are called exploratory. Nobody decides how the rain falls over a year, yet the two rainfall scenarios of the erosion example are a proper scenario set: we cannot change the rainfall regime, only span it. Scenarios of this kind contribute to a better understanding of our world.
Back to the fire. Seven things that matter for how many people get out alive - sort them from the point of view of the authority that writes the fire safety regulation. One of the seven belongs in neither box: work out which, and why.
A question phrased without this distinction tends to be unanswerable. “What will erosion look like in 2050?” asks a model to predict, which it cannot do, and names no decision. “Which of these two grazing regimes holds up better in a year of heavy storms?” names a lever, names a context, and can be answered.
A scenario question has four parts: someone who has to decide, something that this person can change (lever), something they cannot (context), and something they would measure (indicator) for decision support. Assemble one for the herding model. Not every combination is a question that a model can answer - find out which are, and why the others are not.
14.2 Designing a scenario set
You now have a question. A scenario set turns it into a small number of stories that can be compared. Work along the following principles to design your scenario set.
14.2.1 Start from a baseline
Every scenario set needs a reference: the world as it is, or as it was, or the situation before the intervention. The English-language literature calls it the business as usual. Without it, “more dogs” has nothing to be more than.
The baseline scenario is a scenario like any other. It is simulated, not observed, and it is run with the same parameterisation, the same number of replications and the same indicators as the scenarios it will be compared against. Only then is any difference attributable to the lever.
The baseline is usually the one scenario for which observed data exist - the herding model’s current practice, the reconstruction of the actual fire. That makes it the place where validation and scenario analysis meet: the validated model becomes the baseline scenario.
Define the baseline scenario first, and describe it in one sentence of plain language.
14.2.2 Make the contrast large enough
The lesson on parameterisation established that stochastic models return a range of outcomes, not a single value. A scenario difference that is smaller than that range is invisible, no matter how many runs you do.
14.2.3 Hold everything else equal
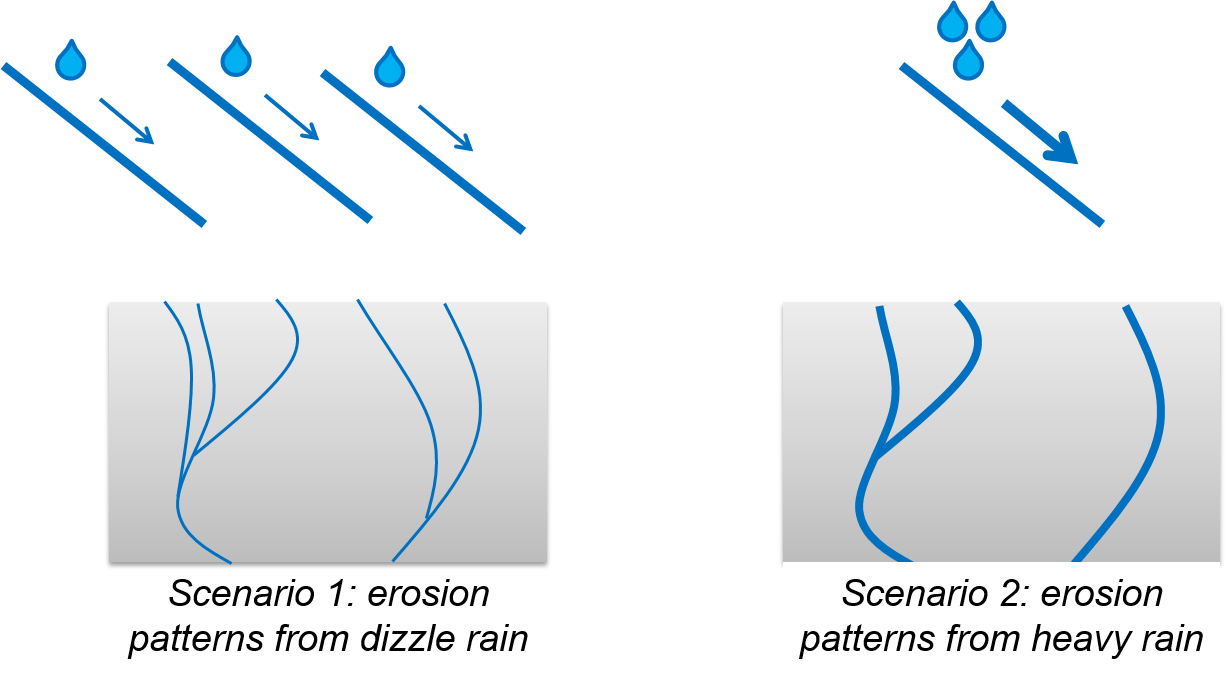
This is the principle that makes a scenario set an experiment rather than a collection of runs. The erosion example that runs through this lesson is a worked example built for this module, on top of the NetLogo erosion model you met in Lesson 8. Its two rainfall scenarios (Figure 14.3) differ in the distribution of rain over the year, and are carefully designed to deliver the same total amount of water. Because of that, any difference in the results can be attributed to the timing. Had the heavy-rain scenario also delivered more water, the comparison would have been worthless.
14.2.4 Keep them few
Two or three scenarios should tell the story. Each additional dimension multiplies the number of simulation runs, exactly as it did for parameters. More importantly, each additional dimension halves your audience’s ability to hold the comparison in their head, and a comparison nobody can follow is not a result.
14.2.5 Make sure everything is set before you start
Which indicators you will record, how many runs per scenario, and how large a difference would have to be before you would call it meaningful. Decide on all three before hit the simulation button.
Depending on the model, the runs may take a while, and there is time enough for a coffee, and some larger models you even need to leave running for a couple of days. It can get frustrating, if you realise in the end that you forgot to adjust this little detail in the code, and you have to redo the whole thing. It’s worth taking your time to double-check everything before you start with the scenario simulations.
14.3 Reading the answer
Now you are ready to run the scenarios. But before you do so, commit to an expectation.
The value of a simulation experiment lies almost entirely in the distance between what you expected and what you got, and that distance cannot be measured after the fact. Once we know an outcome, we unconsciously adjust our memory of what we predicted so that it agrees with what happened. Fischhoff (1975) called this hindsight bias. Only a prediction that you explicitly formulated and wrote down before the run is evidence.
14.3.1 The answer is encoded in patterns
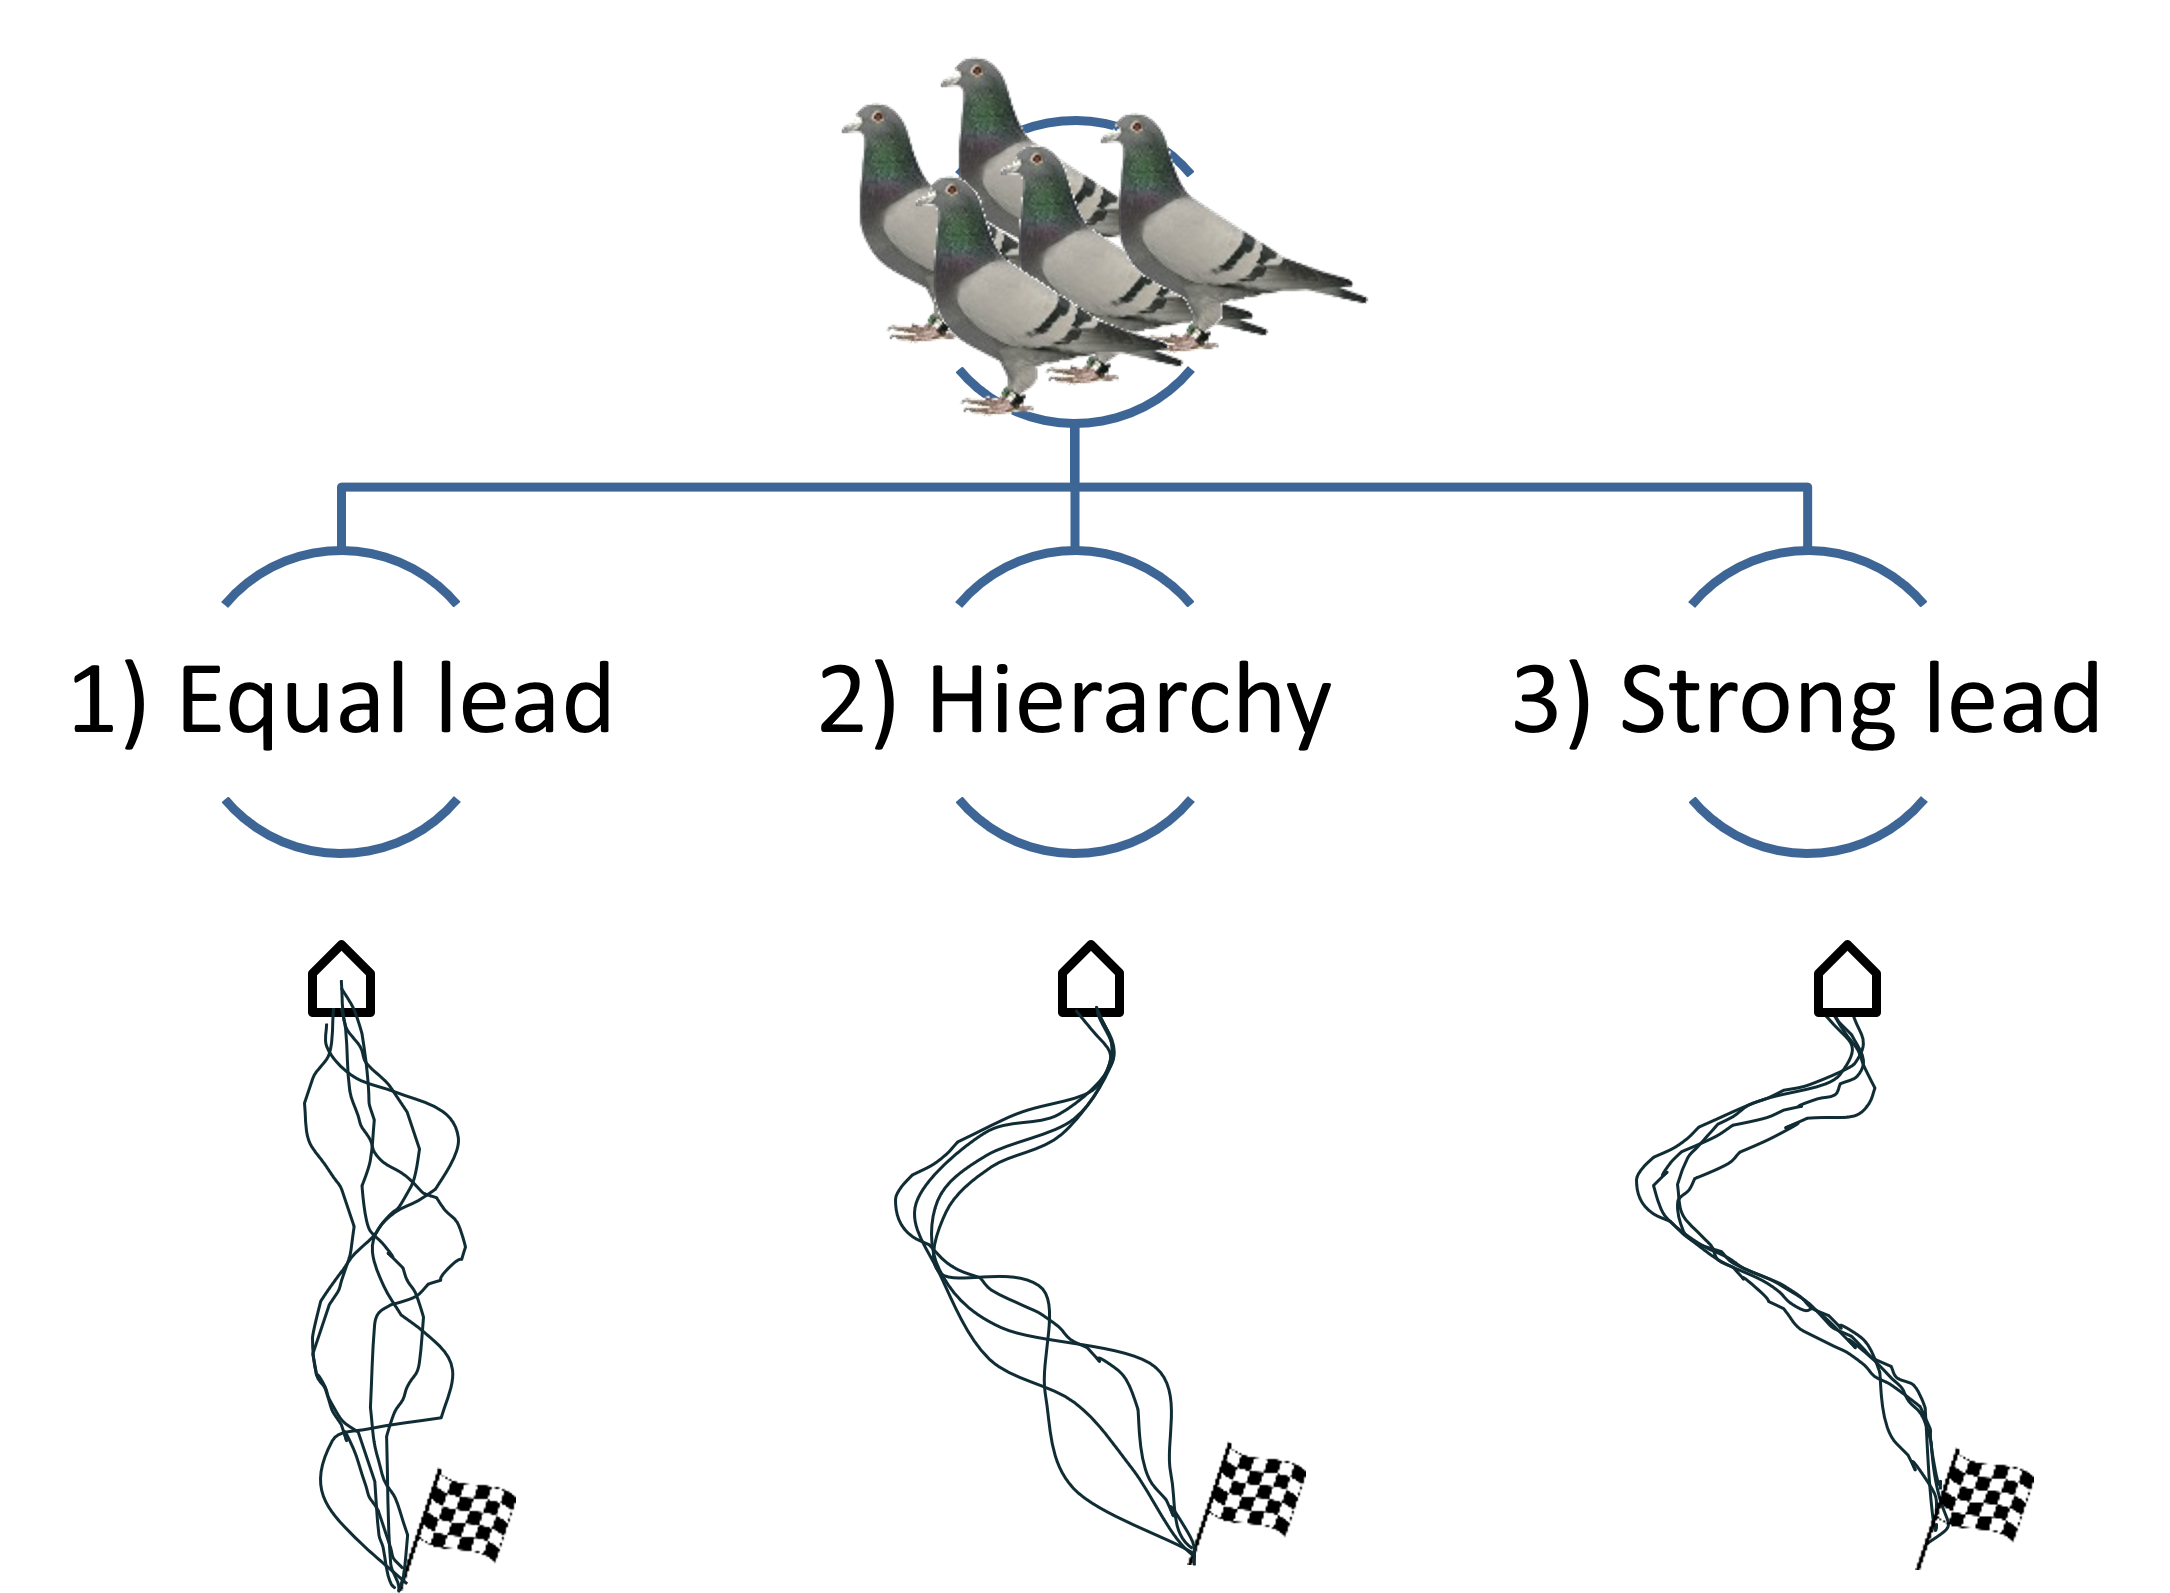
We model space, so the answer usually is a spatial or spatio-temporal pattern rather than a number. Compare the paths the sheep take under each scenario, or where the flock tends to split, or which corner of the field the dogs never manage to clear. Figure 14.4 shows the same principle in our model of homing pigeon flocks (Wallentin & Oloo, 2016), in which three alternative social structures produce three visibly different bundles of flight trajectories, from the wide, tangled paths of a flock in which every bird has an equal say, to the narrow bundle that forms behind a single strong leader. Visualised differences of this kind are frequently more convincing to a practitioner than any statistics.
14.3.2 Look at distributions, not at means
The value of an indicator from a single run is one draw from a distribution, and the mean of many runs is only one property of that distribution. Plot the full distributions of your indicator, one curve per scenario, and compare them to fully understand the results for this indicator.
What you are looking for is overlap. Two curves whose means differ but which sit almost on top of each other describe scenarios you could not tell apart in practice. Two curves that barely touch describe a difference that would be visible to a shepherd on a hillside.
The sandbox in Figure 14.5 has nothing to do with sheep and its numbers are invented. Drag the two sliders and watch what happens to a difference when the world is noisy.
14.3.3 Effect size before significance
This one may sound surprising: statistical significance is not a strong argument! With enough runs, almost any difference becomes statistically significant, because you control the sample size of simulated results yourself. This makes significance a much weaker criterion in simulation than in field research. In simulation research it is thus the size of the actual effect that is more important.
The erosion study makes the point sharply. The mean erosion depth was 2.3 mm under drizzle and 2.4 mm under heavy rain, and the difference was highly significant. It was also 0.1 mm. The difference in eroded area, by contrast, was both significant and large enough to matter on a hillside. Same experiment, same p-values, entirely different practical weight.
Your herding results will most likely show a trade-off: the scenario that pens the flock fastest is not the one that treats the sheep most gently. Which matters more is not a question the model can answer. It is the shepherd’s question, and the modeller’s job is to lay the trade-off out clearly rather than to resolve it.
14.3.4 Robustness beats precision
A precise answer that holds only for one parameter setting is worth less than an imprecise one that holds for all plausible settings. Run your scenario comparison again with the model parameterised slightly differently, using the sensitivity analysis technique from the parameterisation lesson. If the ranking of the scenarios survives, you have a result worth reporting. If it flips, you have learned something more important: the answer depends on a quantity nobody has measured, and that is what your study should say.
14.3.5 Insights arise from the unexpected
Now take out the prediction you wrote down.
If the model confirmed it, you have gained a little confidence and not much knowledge. If it contradicted it, you have gained the thing the model was built for.
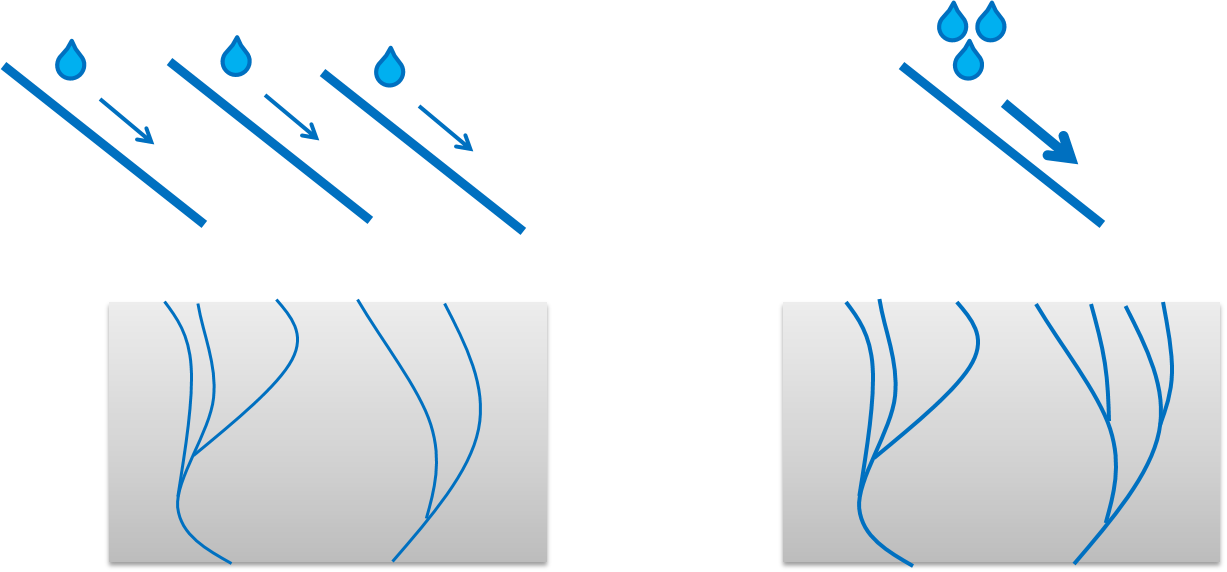
The erosion study is a worked example of exactly that. The hypothesis was that a few heavy rain events produce less erosion, but deeper. The simulations showed more erosion, and only marginally deeper. The hypothesis had to be rejected and reformulated (Figure 14.6).
In the herding model, my guess is that you will find something similar. Two dogs will beat one comfortably. Four dogs may well be worse than two, because they get in each other’s way and the flock splits. If that happens, resist the temptation to call it a bug. Non-linear behaviour of this kind is what emerges from interaction, and it is precisely the class of result that a bottom-up model exists to produce.
14.4 What you may claim
A scenario result is a statement about the model, not about the world. What permits us to make a claim about the real world is the validation work of the previous lesson, but it has its limits.
The first limit is the domain of applicability. Our model of mixed autonomous and human-driven motorway traffic (Reibersdorfer-Adelsberger & Wallentin, 2026) was validated against ten minutes of cars counted from a webcam, in traffic that was one hundred percent human-driven. Its scenarios ask about traffic that is 80% autonomous. Nothing in the validation data supports that, and no amount of further counting could, because the situation does not exist yet. This is not a flaw peculiar to that study. It is the normal condition of scenario analysis: the interesting question is outside the range in which the model could be tested. What allows us to extrapolate is not the data but the credibility of the represented processes, which is why so much of this module has been about getting the mechanisms right rather than the fit.
The second limit is equifinality. Your scenario produced a pattern, and other model structures could have produced the same pattern for other reasons. “This scenario produced that outcome” is not the same claim as “this cause produces that effect”.
The third is that uncertainty must be inseparably communicated together with the result. A number quoted without its range is received and further distributed as a crisp fact. In the first lesson we met the fisheries of the Adriatic, where uncertainty in the input parameters was set aside on the way into policy, and as a consequence the ecosystems were overfished.
This matters most where the results are used. The Crans-Montana reconstruction went out on the evening news while criminal proceedings against the operators of the bar and against municipal officials were under way. A model like this one is read by a court, by a regulator and by bereaved families. The honest form of its finding is not “two more doors would have saved those 41 people”. It is something narrower and more useful: under the assumptions of this model, the additional exits brought the evacuation time below the time that was available. The gap between those two sentences makes for the ethical use of a powerful tool.
Which brings us to communicating the insights gained from scenario analysis to non-modellers and decision makers. Show two or three scenarios, never ten. Show ranges, not points. Support the verbal description with one graphical abstract of the scenarios themselves, as in Figure 14.3, because it is intuitive and it travels.
14.5 Three things to remember:
- Design the scenario set before you run it, including what would count as a difference worth acting on.
- Compare scenarios against a baseline, holding everything else equal, and keep the set small enough to interpret.
- The model answers about the model world. Say what it cannot tell you as clearly as what it can.
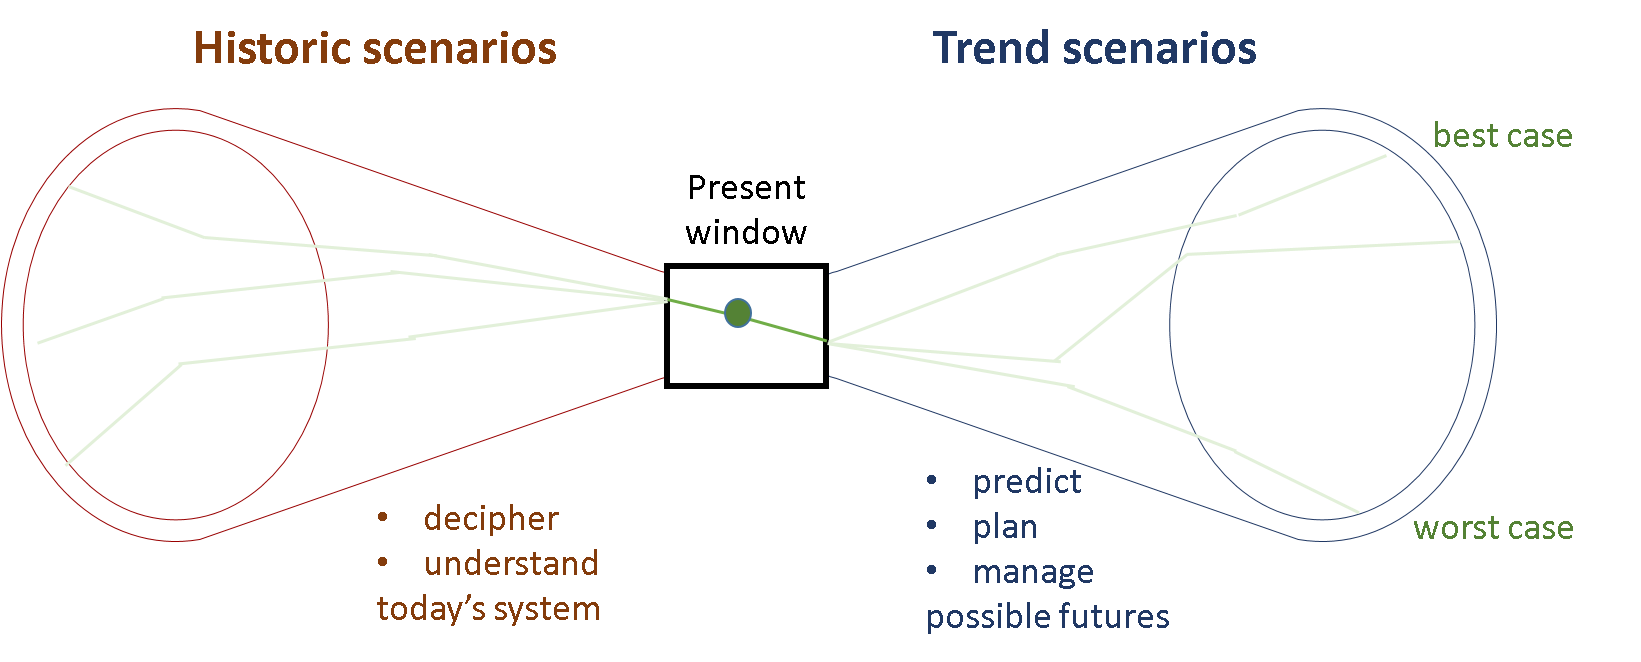
Step by step, and always beyond the reach of the experiment we would rather have run, scenario analysis contributes to a better understanding of the processes that shape our complex world, forwards as well as backwards in time (Figure 14.7).
In the very first lesson we asked why anybody would simulate. This is the answer: because some questions can only be answered by a model, and because asking them well is a skill of its own.