6 Code verification
Verification is the twin of coding: there is no code development without paralleled verification and debugging. In times of AI-generated code, code verification has become even more important. This lesson introduces conventional code testing methods with a specific focus to GAMA, and then looks into verification of AI-generated code.
By the end of this lesson, you will be able to:
- systematically review, understand, debug and test code,
- distinguish syntactic, runtime, and semantic errors, and apply appropriate mechanisms to locate and fix them,
- remain in full control of AI-generated code, while benefiting from the AI tools as much as possible.
6.1 Verification framework
Before we jump into strategic code testing, let us get the three important terms straight:
Validation Did I build the correct thing?
Validation tests, whether a model is an adequate representation of reality for a specific purpose by testing its outcome against observed data. While non-validated, abstract models can be adequate for thought experiments, only a validated model can be used to address real-world, geographic problems. Model validation will be covered in a separate lesson.
Verification Did I build the thing correctly?
Verification is a systematic analysis that tests, whether the conceptual specification of a model (for example a UML activity diagram of an ABM) is correctly implemented.
Verification compares an implemented code to a conceptual model to check, whether the thing was built correctly. This means that a detailed conceptual model must exist before the code is developed. Skipping this step would make the code the only source of information about what the model does. At that point verification is no longer possible — you can only ask whether the code runs, not whether it is the code you wanted. Writing down the model’s purpose and specification, as well as its expected behaviour before coding is therefore the very precondition for verification. And this conceptual model has to be the product of your own thinking. A model is a hypothesis: it states your understanding of the system precisely enough that it can be simulated and confronted with data. If the conceptualisation is delegated to a conversational AI, the simulation still runs, but what it tests is the AI’s understanding of the system, not yours. AI can help you write the code; the hypothesis has to be yours.
Debugging The activity to locate and fix an error in the code.
Debugging follows, if verification surfaces an error. It is the reaction to either a syntax error, a runtime error, or to a semantic error that was surfaced during verification.
6.2 Why AI errors are different
We tend to think that AI makes mistakes where tasks get complex. In practice, AI makes a different kind of mistake to those humans would make: errors tend to appear exactly where everything looks straightforward. This is a consequence of how language models work. Rather than understanding code semantically and logically, they predict the most statistically likely next token based on patterns seen during training. Code that looks plausible gets generated confidently, regardless of whether it is logically correct.
This means verification cannot rely on intuition alone. Errors made by AI do not follow the same patterns as human mistakes — they appear where code looks most plausible, where humans tend to think the code must be correct and not necessarily where it is the most complex (Tambon et al., 2024).
Effective verification of AI-generated code requires three things that need human verification skills:
Domain knowledge: you can only verify what you understand. If you do not know how a process works, you will not notice when the model gets it wrong. Verification requires the ability to form an expectation and compare it against what you observe.
Knowledge of your tools and language: hallucinated operators are only suspicious if you know what actually exists in the language, or at least know where to look. The same applies to file formats, coordinate systems, and API conventions.
Critical distance: the greatest risk in AI-assisted coding is accepting output that looks plausible. Verification requires an active stance: assume errors exist until you have proven otherwise.
A structured verification approach to finding errors is more effective than searching randomly. A prerequisite for a structured error hunt - and frequent source of confusion in working with AI-generated code - is to be aware that GAMA is an object-oriented language that does not execute from top to bottom.
6.3 Three levels of verification
Code can fail at three distinct levels: syntactically, at runtime, and semantically. AI-supported coding is good at fixing syntax-errors and runtime errors, and it can be a real nightmare in introducing unexpected semantic errors.
6.3.1 Level 1 — Syntax errors
Does the code run at all? The GAMA development environment will tell you immediately by flagging an error.
In GAMA: syntactic errors indicate that a piece of code does not conform to the syntax of the programming language. Domain-specific languages like GAML try to use statements that are as intuitive as possible, but computer languages still require precision. The most common sources are:
- missing or incorrect brackets,
- use of statements that do not exist (often just a misspelling), or
- the wrong number of inputs for a command, e.g. one parameter, where GAMA expects two.
Syntactic errors are shown with red markers at the erroneous line. Hover over the marker for more information — this is sometimes useful but does not always point directly to the root cause.
Can you spot the error in the following 2 statements? Which error message do you get?
reflexi myProcess { }if my_value > 150.0 [ write "That's huge!"; ]If the model can be compiled despite a flaw in the code syntax, GAMA will show a yellow warning marker instead. These are often caused by parsing an incorrect data type to a variable — for example, declaring an integer variable and assigning a float value:
int myVariable <- 10.0;Warnings can be tolerated in draft versions of your code, but it is good practice to resolve them.
6.3.2 Level 2 — Runtime errors
Runtime errors happen at code execution, when a particular combination of values, at a particular moment, triggers an error. Typical examples are a division by zero or the attempt to operate on a nil object that has been deleted, or that has not been created yet.
In GAMA: runtime errors appear during a simulation and cause the simulation to stop immediately with an error message (Figure 6.1) in the experiment view.
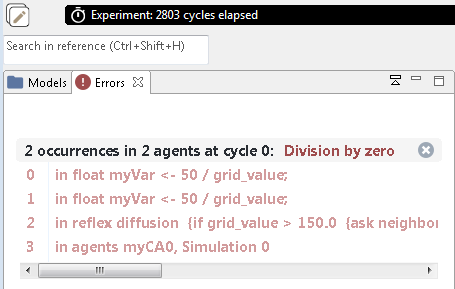
When you encounter a runtime error, try to understand and fix the underlying problem that causes the error. Do not just fix it with a guard clause (an if statement that just skips over divisions by zero). Fencing out the problem would be also the first approach an AI-assistant implements: insist on a fundamental solution!
6.3.3 Level 3 — Semantic errors
Semantic errors are the hardest ones: the code compiles, the data loads, the geometry looks right — but the simulation does something physically or conceptually wrong. The key question is: does the output match what I would expect from a simple test case?
Three general rules for efficiently hunting semantic errors:
- Simplify until the answer is unambiguous. Three agents instead of 300, a homogeneous landscape, the simplest behaviour possible, and no stochastic values. Most semantic errors are invisible in a busy model and obvious in a trivial one. Use
CTRL+7to toggle whole blocks off rather than deleting them.
AI-assistants are very likely to generate far more complexity than you need, because complex code is what their training corpus mostly contains. Ask explicitly for the minimal version to implement what you specify and manually tidy out everything that is not needed.
- Change one thing at a time, and keep a note of what you changed and what happened. Two simultaneous edits produce an uninterpretable result.
When you use an AI-assistant for code implementation, this rule is most likely violated. Be very specific about asking for a single edit, and double check in the git diff (a very good reason to always use git alongside AI-assisted coding!). Do not allow file rewrites.
- Verify as you code, don’t leave it to the end. Whenever you add a new functionality to your code, verify it right away.
This is even more important when working with AI-assistance. Only accept AI output in increments you can actually check. Two hundred lines accepted at once cannot be verified; they can only be trusted.
Further, there are two specific roots of error in simulation modelling worth flagging: inadequate spatio-temporal scales and scheduling issues:
- Spatial and temporal scales: A mismatch between the process of interest, and the spatial / temporal granularity of the model.
Can you spot the semantic error in the following code?
highway_speed <- 130.0;
city_speed <- 50.0;

do move speed: highway_speed;- Scheduling and updates. A mismatch between the order in which processes are meant to happen, and the order in which GAMA actually executes them. This includes the update sequence (each indivudal agent, or the entire population; see Section 4.4) as well as the sequence of processes.
This model aims to model metabolism, where energy is lost at the beginning of each time step. Which output would you expect from the write statement?
global {
    init { create animals number: 2; }
}

species animals {
    int energy <- 100 update: energy - 10;

    //check, whether the metabolism works as expected
    reflex check_metabolism {
        animals another_animal <- one_of(animals - self);
        write "" + self + " (energy " + energy + ") sees " + another_animal + " with energy " + another_animal.energy;
    }
}

experiment simulate type: gui {
    output {}
}
This is the console output of the write statement. What happened? Can you describe the semantic error?
animals(0) (energy 90) sees animals(1) with energy 100
animals(1) (energy 90) sees animals(0) with energy 90In order to spot such issues, you need to proceed like a detective, specify what you expect and hunt for traces of evidence, whether your expectations are met. So it’s good verification practice to build a dashboard to monitor what exactly happens during a simulation.
In GAMA: GAMA provides a rich set of possibilities for exploratory data visualisation at simulation runtime.
6.4 Finding semantic errors
Hunt for semantic errors actively and strategically: in the verification workflow (Figure 6.2) of a simulation model you start from your expectation, how the system behaves. Then confront it with the simulated behaviour by observing state values as the simulation runs. To get a full picture of what happens during the simulation, build an observation dashboard that combines variable-dependent visualisation in the map display, graphs, and monitors.
Wherever you find a mismatch between what you expected and what is simulated, you have found either a surprising, emerging property, or a semantic error. Narrow it down to understand, how it is generated by inspecting individual cells or agents, and by letting events trigger selected agents to report their state to the console.
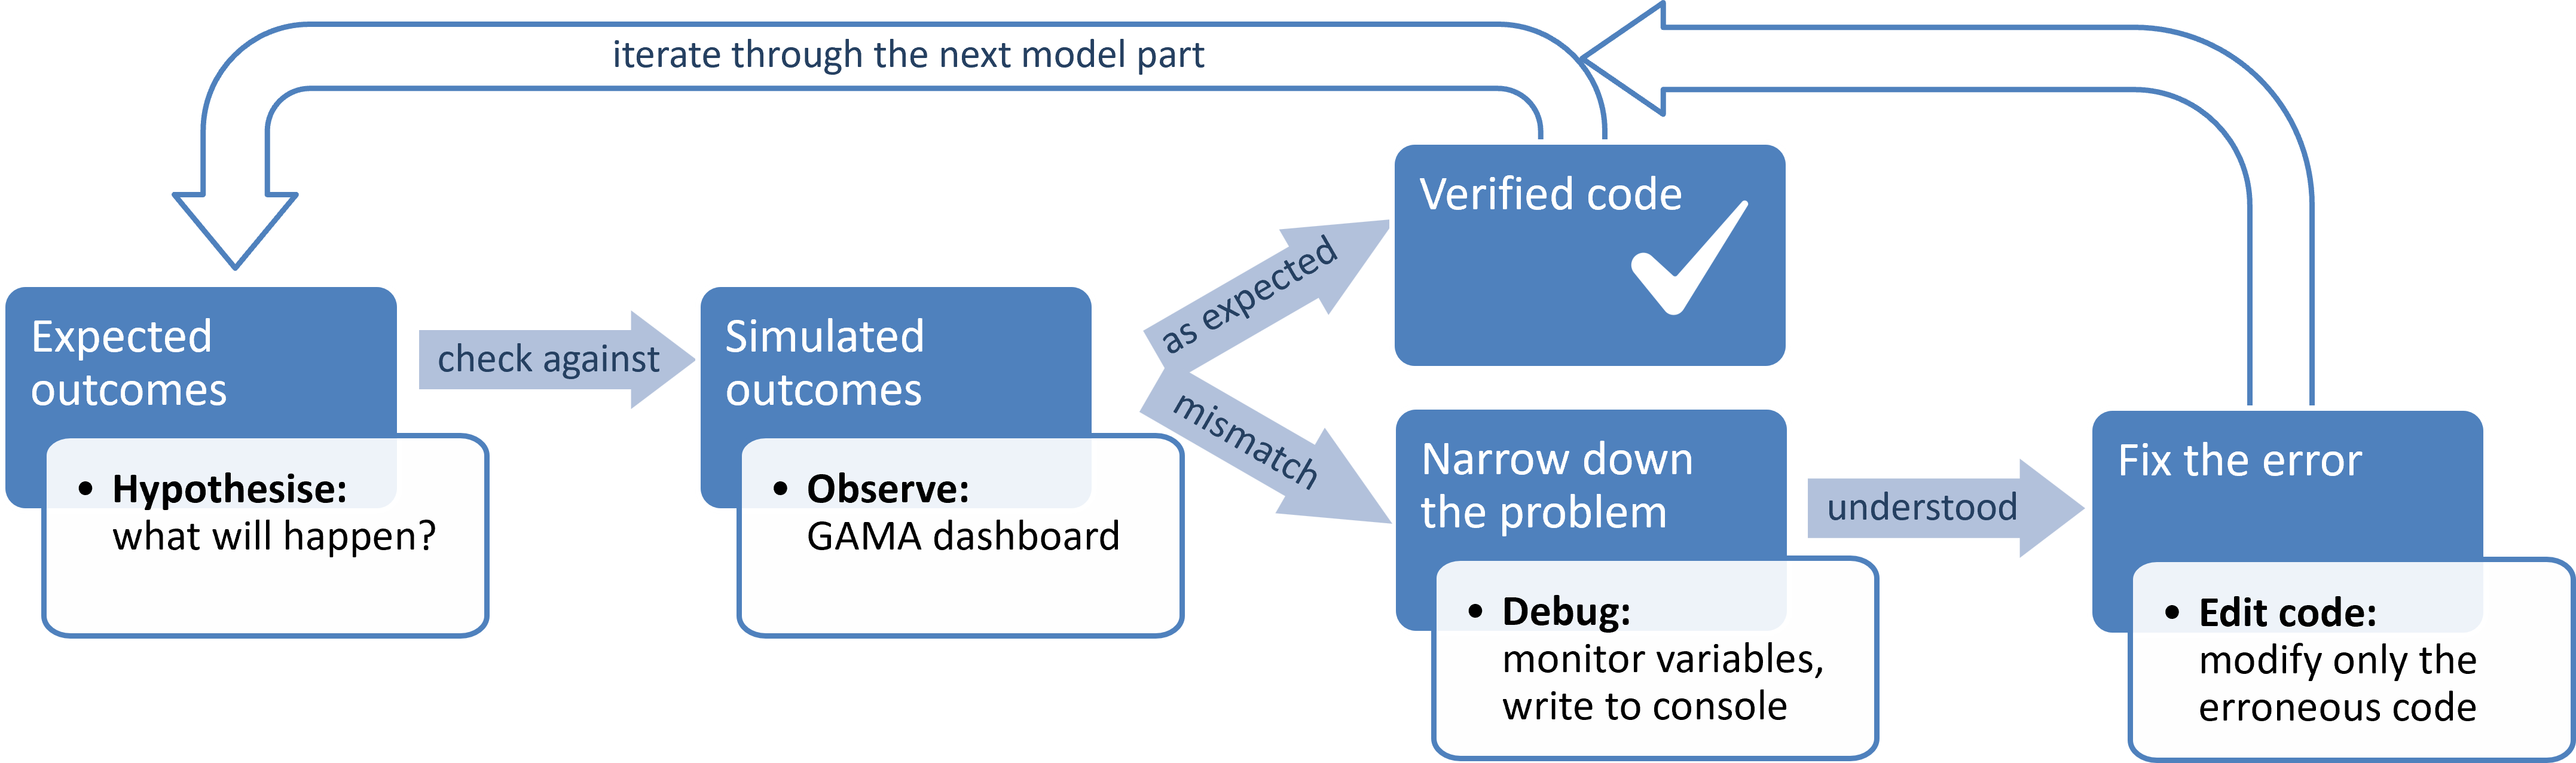
Understand exactly how the error is generated before touching any code. Changing code randomly until the symptom disappears merely replaces one silent semantic failure with another.
Observation dashboard
An observation dashboard that shows what happens during a simulation run is the key to systematically hunt for semantic errors in a model. A dashboard is full of small instruments — monitors, maps, charts, labels — each of which measures one thing about the running simulation. The design rule throughout: ask the question first, choose the widget second. A lot of randomly assembled widgets show a lot but reveal little.
Let’s consider a minimal grazing model. Three sheep wander a 4 × 4 grid. Each cell starts with 20 units grass, each sheep with 20 units energy. At each step:
- each cell regrows +1 unit grass (with an upper limit of 30),
- each sheep eats a fixed 5 units grass from the cell it stands on (if there is enough grass) and converts it to energy,
- each sheep burns energy, corresponding to 2 units grass for metabolism.
The model compiles, runs, and looks completely normal: sheep wander, grass is grazed and grows back. Nothing crashes. However, along the way the dashboard will surface a couple of semantic issues in the model.
The exercise will go through the dashboard design process in six steps:
| Step | Question | What you learn |
|---|---|---|
| 1 | What do I want to see, but can’t? | design heuristic |
| 2 | How much? | collect, aggregation, monitor |
| 3 | Where? | grid colour, normalisation with rgb |
| 4 | When? | cycle vs step, start date, clock overlay, series chart |
| 5 | Who? | histogram, map labels, inspector, write, browse |
| 6 | Anything else? | encoding trade-offs, what a widget hides |
Download the model, follow along the six steps of building a verification dashboard, and find the semantic errors!
6.4.1 Step 1 — Explore, before you design the dashboard
Run the model as it stands and watch it for a while. Then try to come up with three questions about this pasture that support verification and the display cannot answer yet.
6.4.2 Step 2 — How much? (monitors)
Every aggregate rests on one operator that sums cell variables across the entire grid, or agent variables across the entire population. This works as follows:
sum(pasture collect each.grass)
reads as: take the pasture CA, read each grass value, and then sum it up. each is the placeholder for the cell currently being read.
Monitors go in the output block of the experiment, as siblings of display — not inside a display:
output {
    display grazing_view { ... }

    monitor "total grass"        value: sum(pasture collect each.grass);
    monitor "total energy"       value: sum(sheep collect each.energy);
    monitor "mean energy"        value: mean(sheep collect each.energy);
    monitor "poorest sheep"      value: min(sheep collect each.energy);
    monitor "cells at ceiling"   value: pasture count (each.grass = max_grass);
    monitor "cells below a meal" value: pasture count (each.grass < grass_per_meal);
}
count counts all instances that are “true”.
Step over thirty cycles. Cells at ceiling climbs while cells below a meal stays low. What does that combination say about how hard three sheep graze this pasture? Any observations about the sheep energy?
The main observation is that all sheep have the same energy level. After about 30 steps the energy gets depleted, although the majority of pasture cells offer enough food. Something is wrong here, but we need more information to understand what happens.
6.4.3 Step 3 — Where? (map display and colour normalisation)
A map is not a picture of the model. It is one variable visualised spatially. Grid cells carry a built-in color attribute, so the map becomes a measuring surface the moment that the color depends on a variable.
The technique is normalisation. A colour channel runs 0–255; grass runs 0–max_grass. Express the state as a fraction of its own maximum, then stretch that fraction across the channel. Set the green colour value right after grass changes:
reflex regrow {
    grass <- min([grass + regrowth_per_step, max_grass]);
    color <- rgb(0, int(255 * grass / max_grass), 0);
}
grass / max_grass is a ratio between 0 and 1; multiplying by 255 scales it to the channel. Change max_grass and the map rescales itself, because the reference is the variable’s own maximum rather than a number you guessed. Empty cells come out black — legible but heavy. Two channels read better:
int g <- int(255 * grass / max_grass);
color <- rgb(255 - g, 255, 255 - g);        // white when empty, green when full
Now try the same for the sheep:
draw circle(1) color: rgb(int(255 * energy / ???), 0, 0);There is nothing to put in place of ???. energy has no ceiling, so every ramp you invent will saturate and the map goes blind. Unbounded variables cannot be colour-normalised. You can encode energy by size instead, which has no upper limit to violate — though even size needs a clamp eventually, or a rich sheep will cover the pasture:
aspect default {
    draw circle(min([40, 1 + energy / 10])) color: #black;
}Observe the map now. Something goes totally wrong! Describe the issue: What did you expect to see? What did you observe? Look into the code: can you localise the error with the information you have? Can you fix it?
Rerun the model. Did the code edit fix the problem?
The described error is fixed. And it also fixed the shrinking sheep energy! However, something about where grass is removed is still off. What exactly? Again, describe the issue along the expect - observe - localise - fix pattern.
Rerun the model. Did the code edit fix the problem?
6.4.4 Step 4 — When? (calendar, clock, trends)
The model has counted cycles, which are just numbered iterations. step is different: it declares how much simulated time one cycle stands for, and every rate in the model is read against it. Set the variables in the global section, anchor cycle 0 in real time with start_date, and take the launch time from #now:
date start_date <- #now;
float step <- 1 #day;
Choosing step forces a decision the model has so far avoided. Grass regrows slowly, sheep move quickly, and one cycle cannot represent both. You have to name the process of interest and let the other one be approximated. Here it is the grass–sheep interaction, so a day is the right temporal grain.
Now, you have to adapt also the spatial dimension: a sheep’s speed is given by the distance it moves per time step. So, how far does a grazing sheep go in 1 day? Let’s assume: 100m.
In the global section declare a my_speed variable and assign the speed.
my_speed <- 100.0 #m / #dayIn the sheep section let the sheep wander with my_speed:
do wander speed: my_speed ; Now, what is a good dimension of a pasture? You have to set the spatial extent of the GAMA world explicitly, otherwise, it will be the default size of 100m by 100m. The sheep could not move a single step in such world! Add a shape variable to the global section:
geometry shape <- square (1 #km);Rerun the model to cross-check the spatial dimension. Do you see how agent size has also scaled? Sheep are now (1 + energy / 10)#m ≈ 3 m dots in a square 1#km world.
In the map display switch on the display’s bottom overlay with coordinate locations and scale bar: click somewhere into the map and then press Ctrl+O.
100 m/day is not the speed of a sheep. It is the speed at which a grazing flock relocates, chosen to represent a grazing interaction between sheep and the pasture. Once we put a unit to time, we explicitly tied space and time to each other: change one and you must change the other. The model can no longer represent anything faster — fleeing a dog, or being herded. That is a limit of the model, not a bug in it, and it has to be stated rather than hidden.
Put the clock on the map with an overlay, a layer that stays fixed while the map zooms:
display grazing_view type: 2d {
  grid pasture border: #lightgray;
  species sheep aspect: default;

  overlay position: {5 #px, 5 #px} size: {220 #px, 40 #px}
    background: #black transparency: 0.4 {
      draw string(start_date + step*cycle, "dd MMM yyyy") at: {12 #px, 26 #px}
      color: #white font: font("Helvetica", 14, #bold);
    }
}
Then add a chart that shows how energy and grass develop over time:
display trends type: 2d {
    chart "stocks over time" type: series x_label: "day" y_label: "units" {
        data "total grass"  value: sum(pasture collect each.grass) color: #green marker: false;
        data "total energy" value: sum(sheep collect each.energy) color: #red marker: false;
    }
}
Run the model. Does everything work as expected?
6.4.5 Step 5 — Who? (individuals)
Aggregates hide variations between individuals: energies of 200, 40, 40 have the same mean as 93, 94, 93, and only one of those pastures is fair. Add a bar per sheep:
display population type: 2d {
    chart "energy per sheep" type: histogram {
        datalist legend: sheep collect each.name value: sheep collect each.energy;
    }
}
Put the same number on the map, so the spatial and the individual view can be read together:
aspect default {
    draw circle(min([40, 1 + energy / 10])) color: #black;
    draw string(energy) at: location + {20, 0} color: #black
         font: font("Helvetica", 10, #plain);
}
Then zoom into a single agent, three ways:
Interactively — right-click a sheep in the map and choose Inspect for a live view of all its attributes; the same works on a cell.
In code — in the global section tag one agent and let it report at an interval that keeps the console readable:
reflex report when: every(10 #day) {
    ask first(sheep) {
        write "" + (start_date + step*cycle) + "  " + name + "  energy " + energy + "  on " + my_pasture;
    }
}
Or add a line into the output section of the experiment to make GAMA open a table with selected attributes for all sheep individuals:
output {
    browse sheep attributes: ["name", "energy", "my_pasture"];
}
6.4.6 Step 6 — Anything else?
Add one widget that answers a question none of the existing panels can answer. In two sentences, state what it shows and what it hides.
Finally, download the complete dashboard model and compare it with your own solution.
Every encoding suppresses something, and making explicit what should be tested, and what is not tested, is exactly the work that cannot be delegated. An AI-assistant will happily generate all six panels of this dashboard in one go, and they will look convincing — but choosing what each panel must be able to contradict, and knowing what it quietly hides, is the modeller’s judgement. Keeping that judgement is the difference between a human in the lead, who sets the questions and audits the answers, and a human in the loop, who only approves what was generated.
Where AI-assistants help most:
- explaining unfamiliar code line by line;
- checking for logical consistency within the code;
- generating an observation dashboard with displays, charts, monitors, once you have decided what you want to see;
- drafting a model description from finished code — which is also a verification exercise, since a description that does not match your intention exposes a mismatch.
Where they help least:
- deciding what the model should do;
- choosing spatial and temporal grain;
- judging whether an unexpected result is emergence or a bug;
- stating limitations.